This walkthrough covers three things, in order: where sign-in actually starts, every option available while logging in, and what you land on once you're through the door — the high-level windows, tabs, and navigation that make up the DataKnits shell.
1. Where Login Starts
DataKnits is a single-page application — there's no separate marketing site to click "Login" from. The app itself is the login screen until you're authenticated. On first load, the app doesn't assume you're logged out; it asks the backend. A call to /auth/me checks for a valid session cookie, and only once that check resolves does the app decide whether to show the sign-in screen or the workspace.
This matters for one practical reason: your session isn't a token sitting in browser local storage that JavaScript can read. It's an httpOnly cookie set directly by the backend — invisible to the frontend, and safer against certain classes of attacks (like script-injected token theft). The tradeoff is a brief loading spinner on every fresh page load while that cookie gets validated server-side, before anything else renders.
If that check comes back unauthenticated, you land on the sign-in screen. That's where login actually starts.
2. Signing In: What Options Exist
Sign-in is a staged flow, not a single form. Here's the exact sequence.
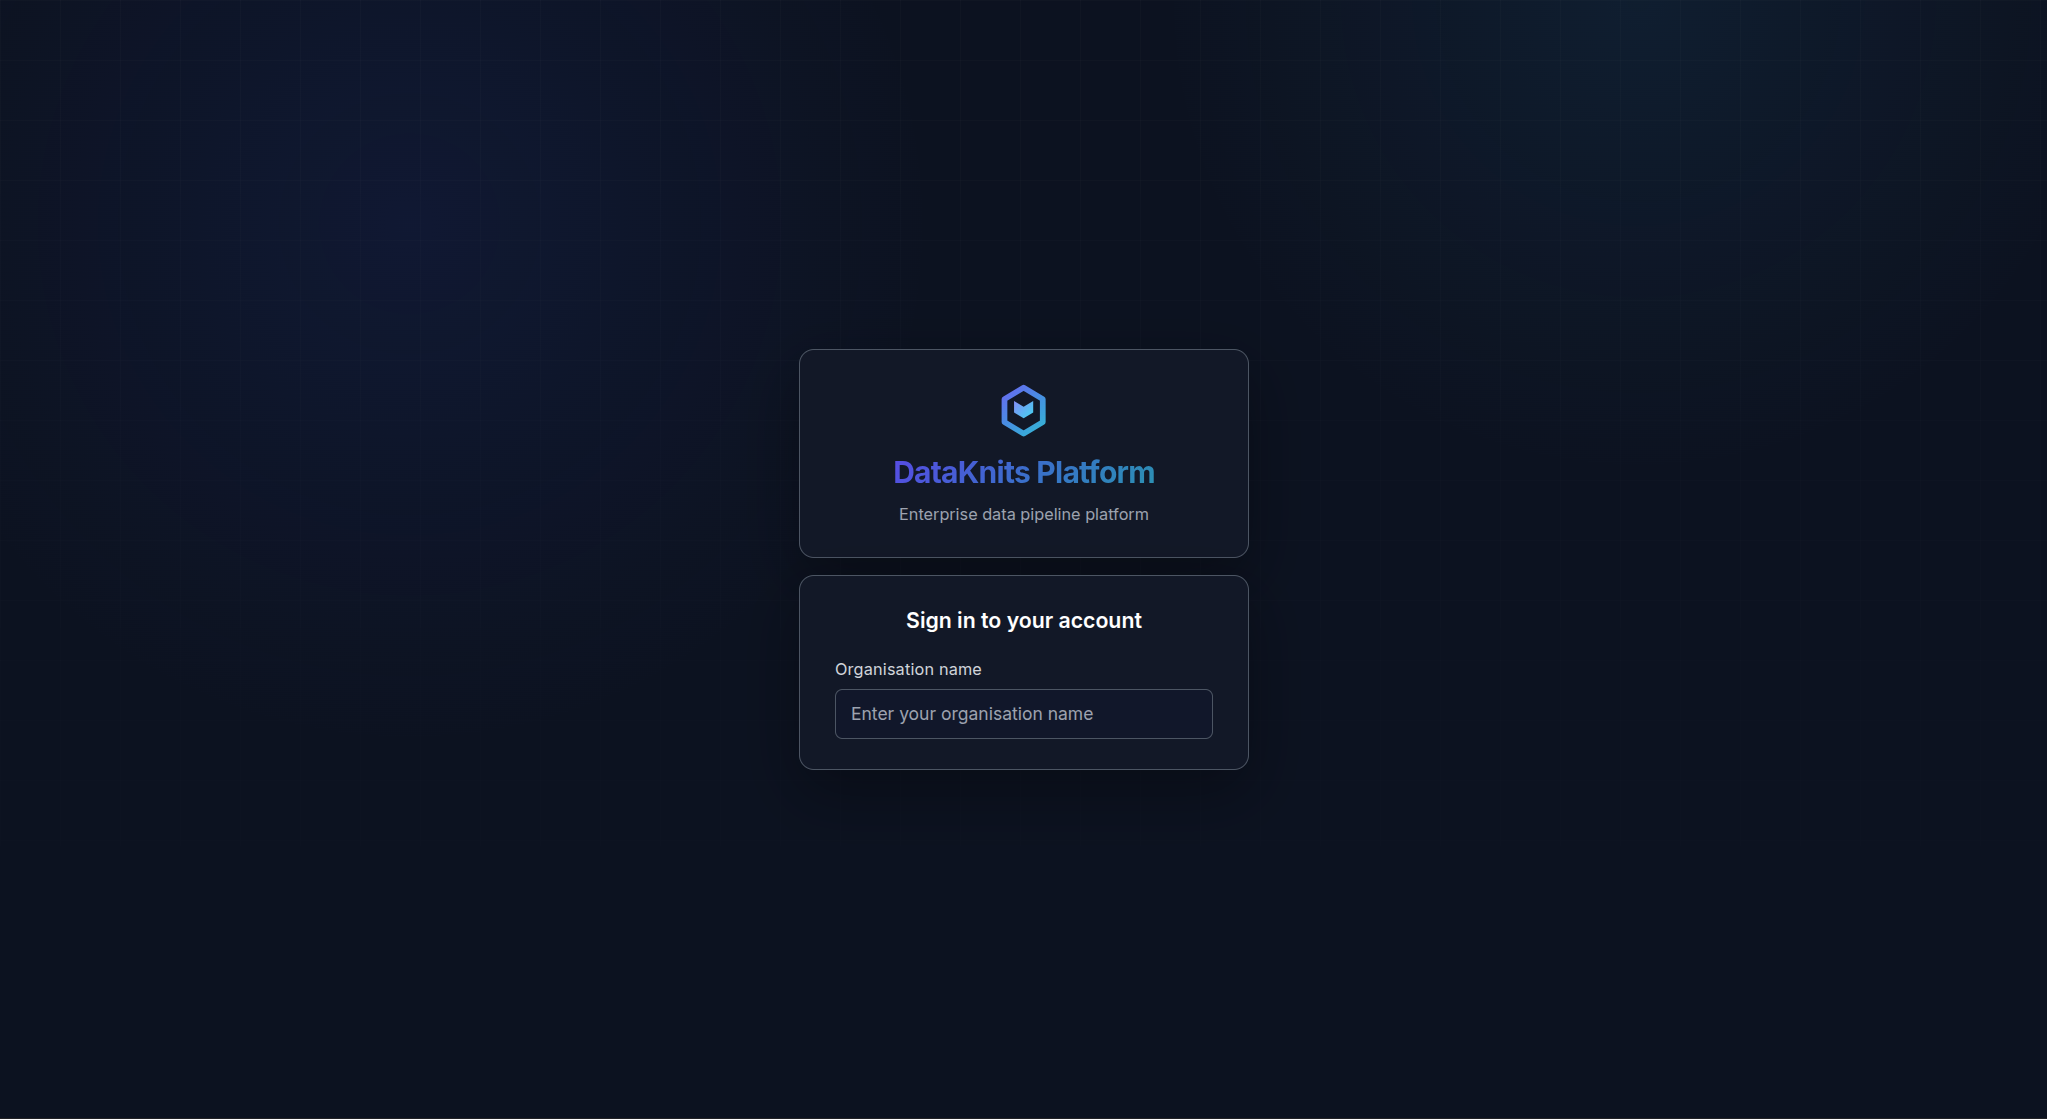
Step 1 — Organisation name
The first thing you're asked for isn't an email or password — it's your organisation name. DataKnits is multi-tenant, so the platform needs to know which tenant you belong to before it can even show you the right login method. You type your org name and hit Continue.
Step 2 — The platform looks up how your organisation signs in
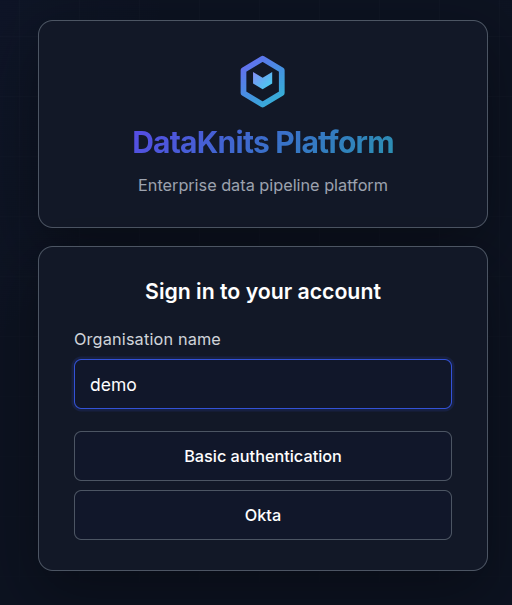
Once you submit an organisation name, DataKnits calls the backend to resolve it to a tenant and fetch that tenant's configured authentication modes. This is the important part: not every organisation logs in the same way. Depending on what's been configured for your tenant, you'll be offered some combination of:
- Basic authentication — the standard email + password flow, if local login is enabled for your tenant
- Microsoft Entra ID (Azure AD)
- Okta / Auth0
- Google Workspace
- Generic OIDC
- SAML 2.0
Each enabled method shows up as its own button. If your tenant has both local login and one or more SSO providers configured, you'll see all of them and choose.
Step 3a — If you choose Basic authentication
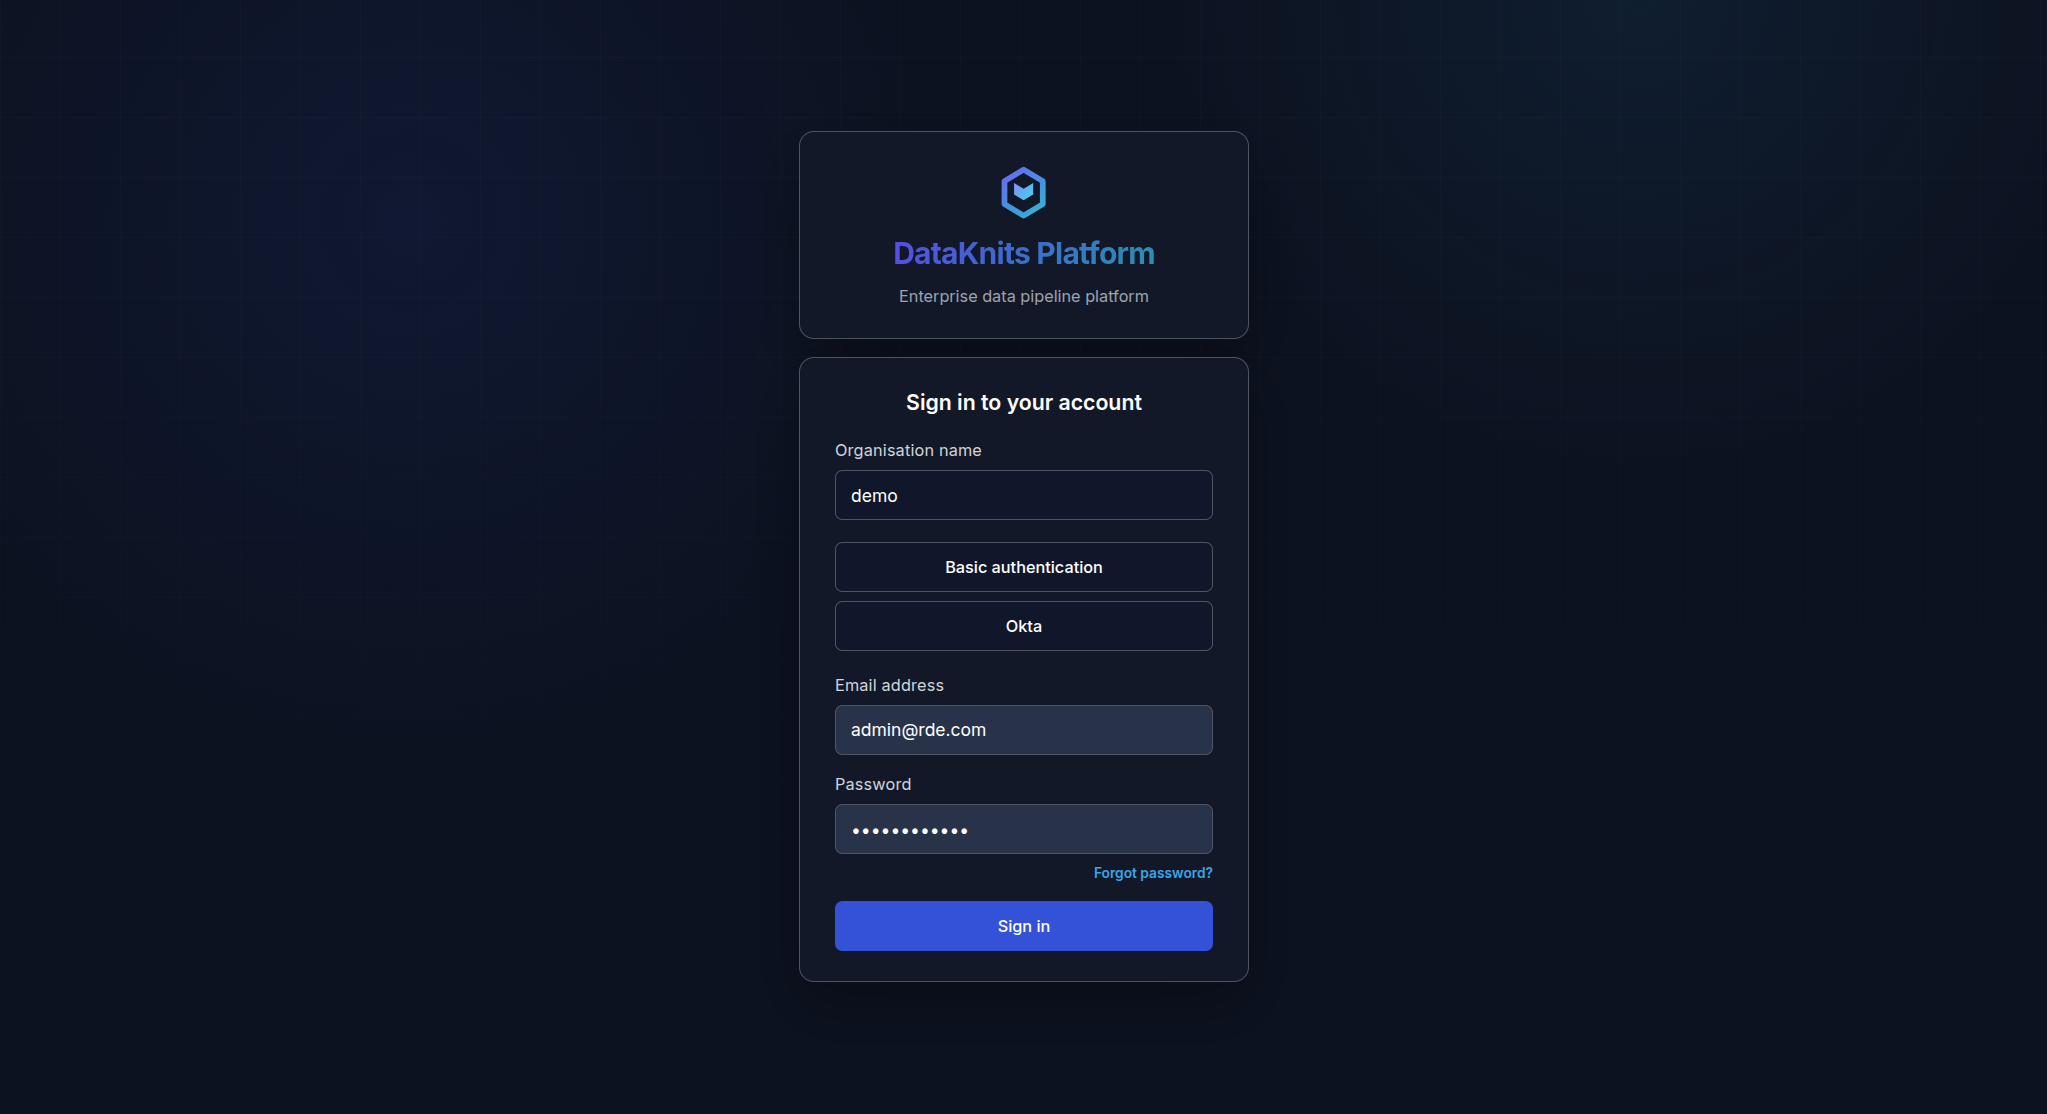
You get a standard form:
- Email address
- Password
- A "Forgot password?" link, which opens a password-reset request modal (you provide your email and organisation name; the reset flow is handled server-side from there)
- Sign in button
Step 3b — If you choose an SSO provider
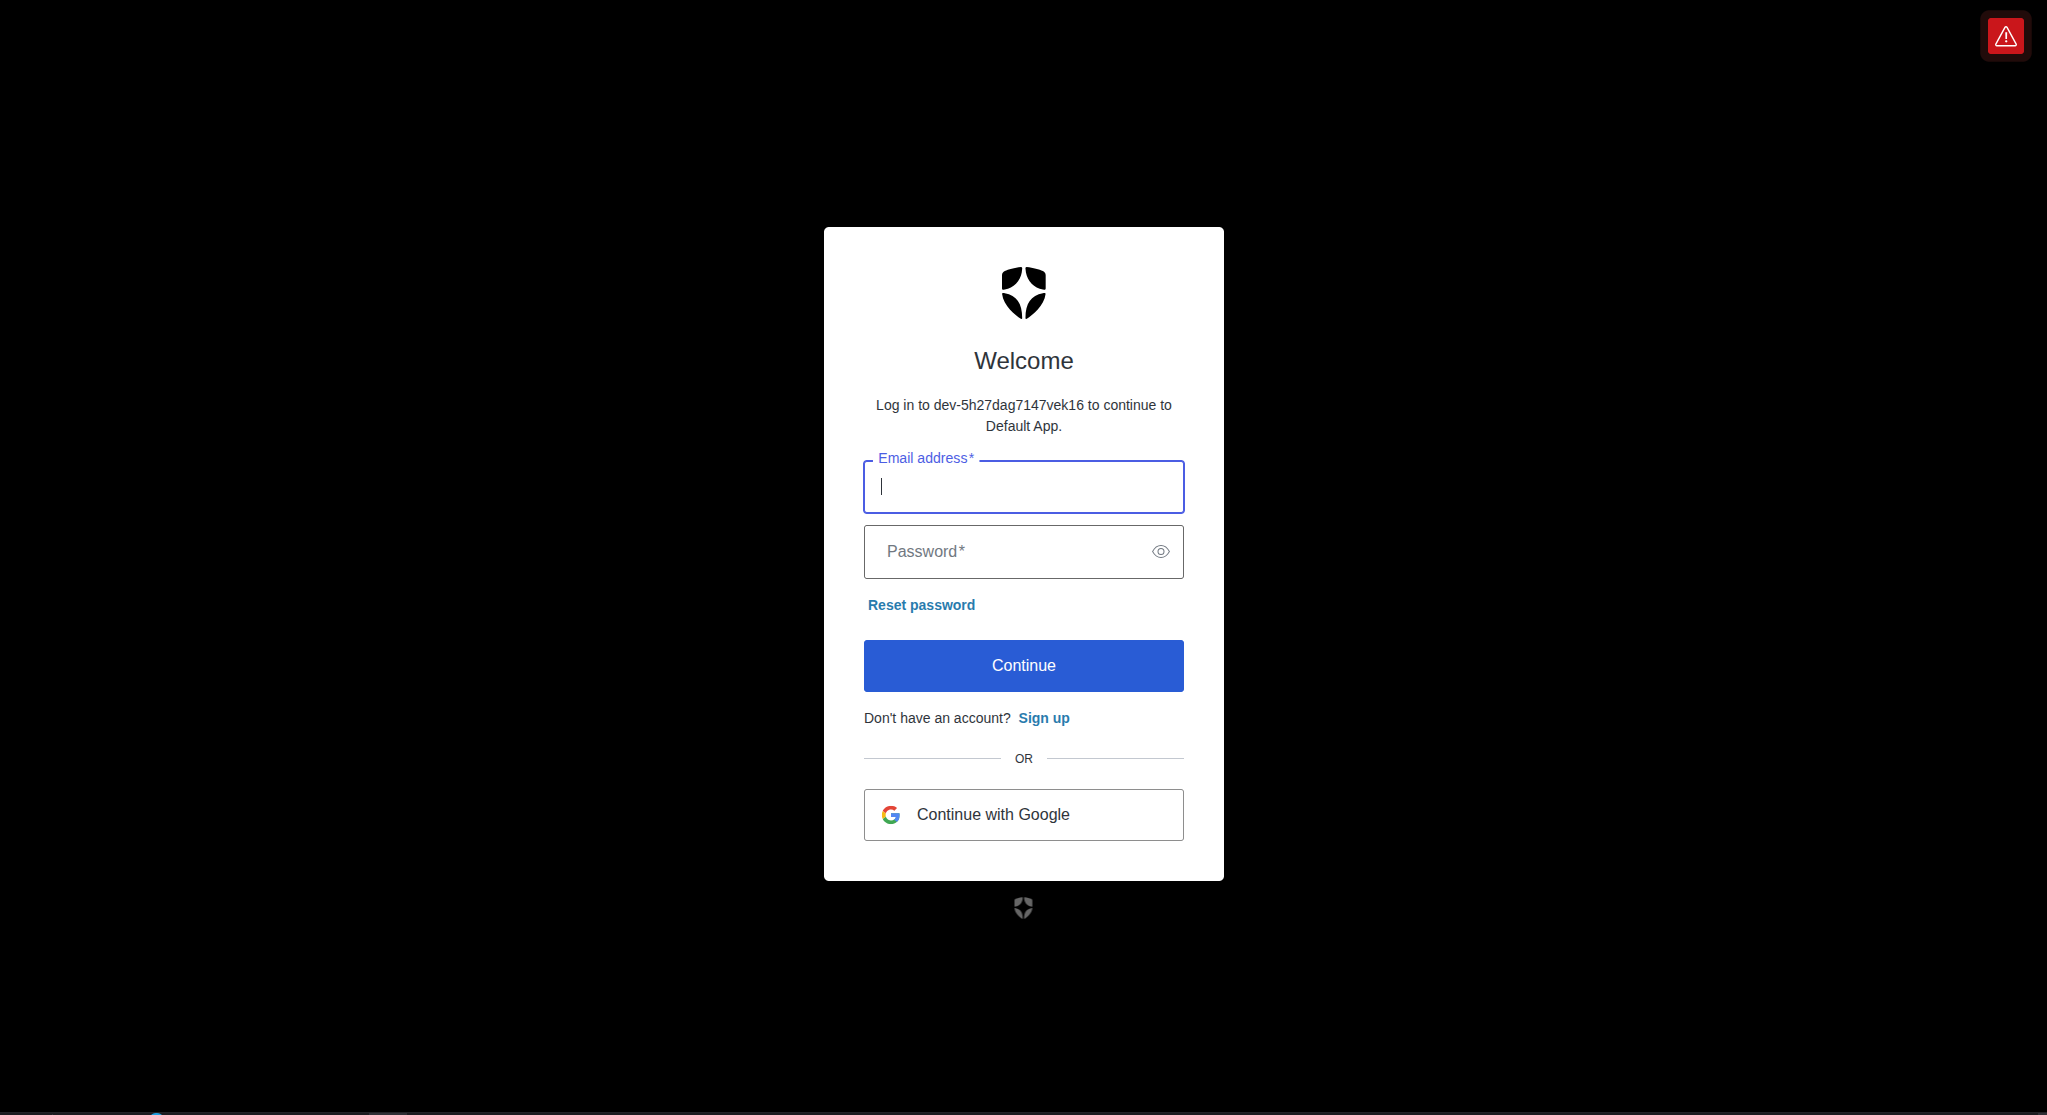
Clicking a provider button redirects your browser to that provider's sign-in start endpoint (/auth/sso/{provider}/start), tagged with your resolved tenant ID. Authentication happens with the identity provider itself — DataKnits hands off completely; you're on the provider's own hosted login page, not an embedded DataKnits screen. DataKnits picks the session back up once the provider redirects you back.
3. The Shell: Header, Sidebar, and Tabs — Not Pages
Before describing what you land on, it's worth understanding the overall shape of the app, because it's not a traditional multi-page site. Every single object you open in DataKnits — a pipeline, a connection, the monitor, settings, anything — opens as a tab inside one persistent shell. There's no page navigation or URL routing between screens; the tab strip is the navigation.
That shell has four regions:
- Header (top) — global actions and context-aware toolbar
- Left sidebar — the full navigation tree
- Tab bar — every open object, one tab each
- Main area — whatever the active tab is showing
4. Your Home Page: Quick Access
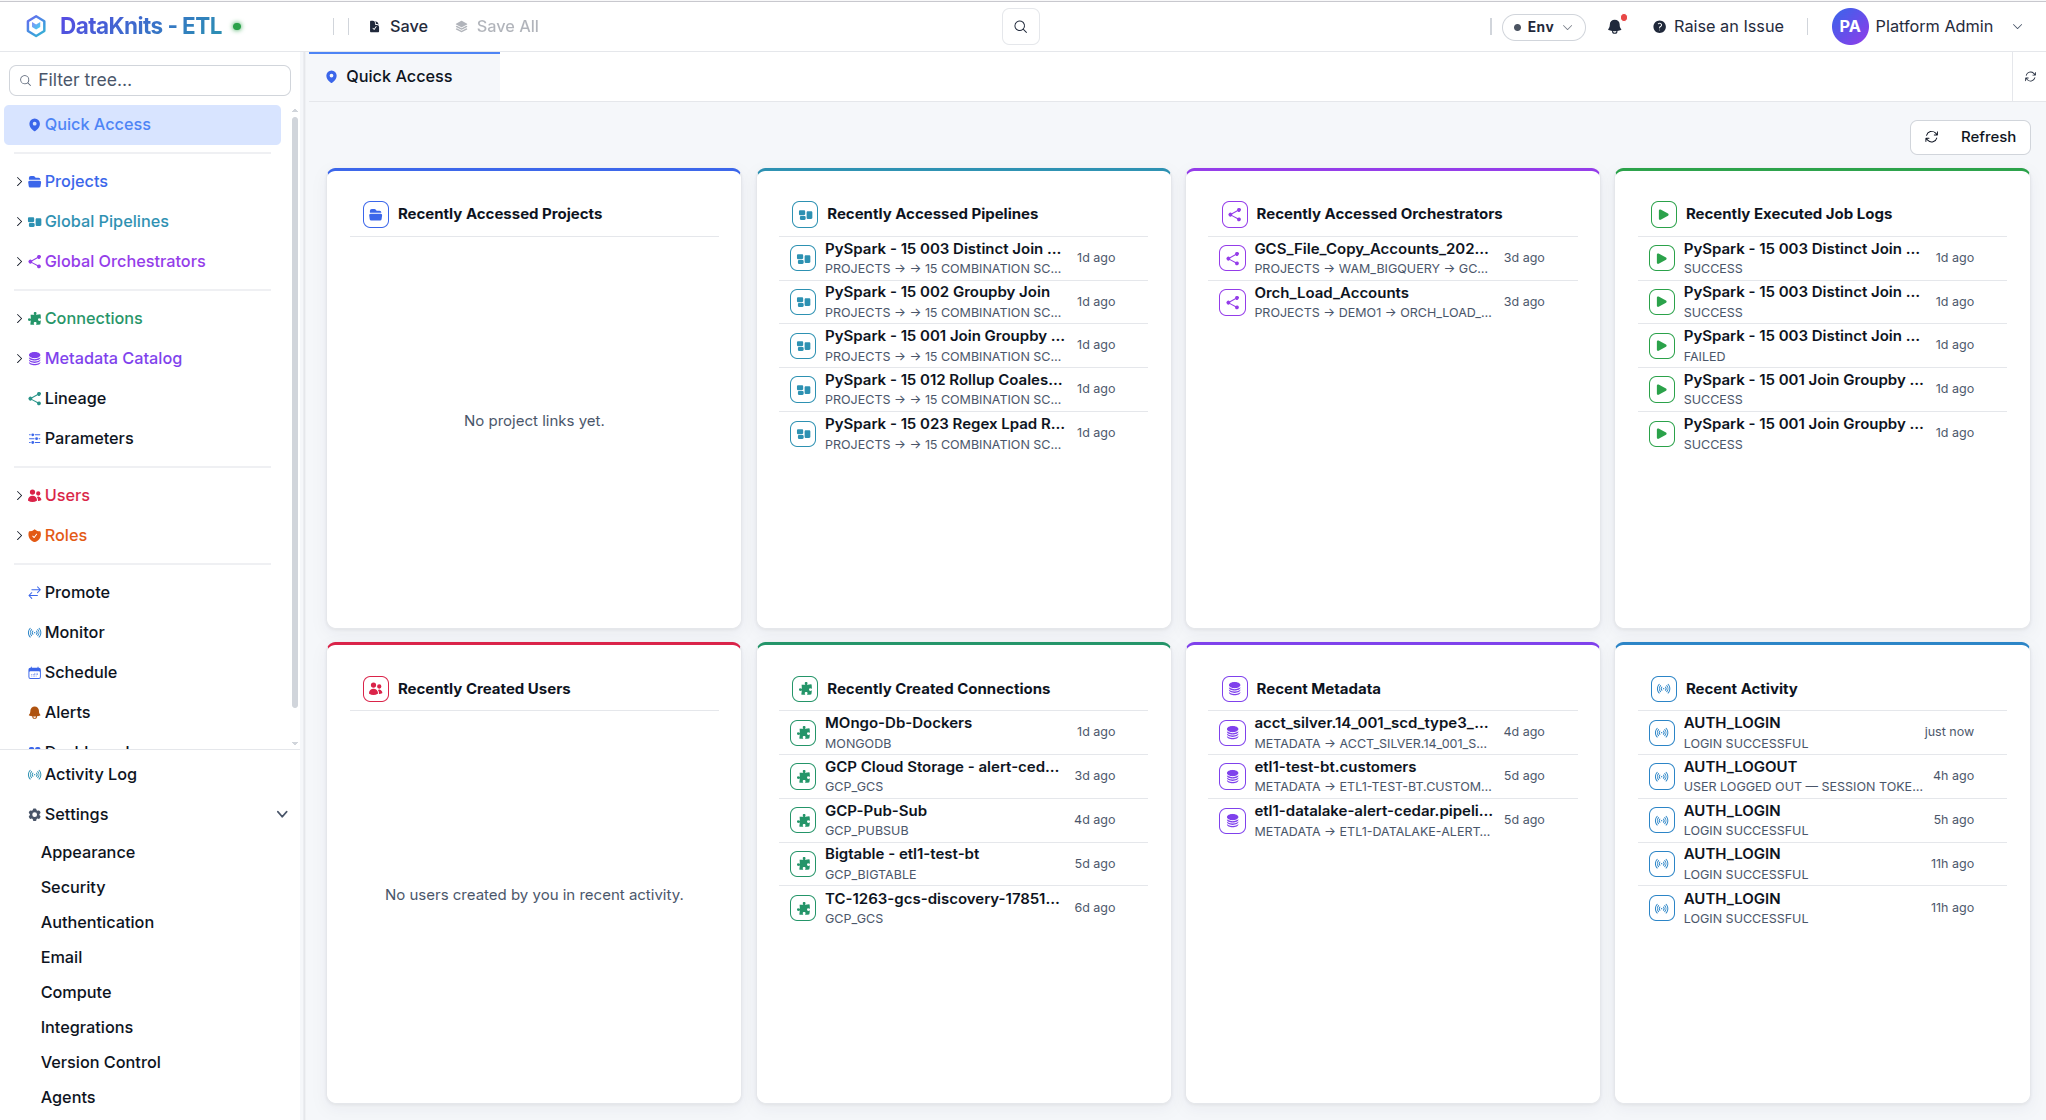
Unless you've set a different preference, the tab that opens automatically after login is Quick Access — and it's genuinely built as a personal dashboard rather than a generic welcome screen. It's laid out as an 8-panel grid, each panel scoped to you, the logged-in user:
| Panel | What it shows |
|---|---|
| Recently Accessed Projects | Projects you've personally opened recently |
| Recently Accessed Pipelines | Same, for pipelines |
| Recently Accessed Orchestrators | Same, for orchestrators |
| Recently Executed Job Logs | Your own recent pipeline/orchestrator runs, with status |
| Recently Created Users | Users you personally created (pulled from the audit log) |
| Recently Created Connections | Connections you personally created |
| Recent Metadata | Metadata objects you've recently browsed |
| Recent Activity | Your recent audit-logged actions |
Every row is clickable and opens the underlying object as a new tab. There's a manual Refresh button, and empty panels show a plain, honest message (e.g. "No pipeline links yet") rather than a fake placeholder.
Your landing page is configurable
Quick Access is the default, not the only option. In your preferences, you can instead set your landing page to:
- Monitor — jumps straight into the execution monitor
- Governance → Users — useful if you're an admin who mostly manages people and access
5. The Header, Piece by Piece
Reading left to right, the header contains:
- Logo + brand and a small green "system ready" status dot
- A context-aware toolbar that only appears when a pipeline or orchestrator tab is active: Validate, Run (F5), Generate Code, Save / Save All (Ctrl+S / Ctrl+Shift+S), and Undo/Redo placeholders
- An unsaved changes indicator — when you have dirty tabs or in-progress config drafts, a small warning pill appears (e.g. "2 unsaved · 1 draft") that opens a review dialog listing every pending change, with the ability to commit or discard each one individually
- Global search (Ctrl+K) — searches pipelines and orchestrators by name and lets you jump straight to a result with the keyboard
- An environment selector — a color-coded pill (red for production, green for non-production) so it's always visible which environment you're pointed at
- Notifications bell with an unread indicator
- Raise an Issue — opens a dedicated tab for filing a problem report
- User menu — your avatar and name, expanding to: My profile & preferences, Change Password (12-character minimum enforced client-side), and Sign Out
6. The Left Sidebar: Everything You Can Navigate To
The sidebar is a single scrollable rail. From top to bottom, it contains:
Your workspace tree
- Projects (expandable) → each project contains Pipelines, Orchestrators, and Folders (which nest further pipelines, orchestrators, and sub-folders)
- Global Pipelines — pipelines not tied to any project
- Global Orchestrators — same, for orchestrators
Data & structure
- Connections — grouped by technology
- Metadata Catalog — a browsable tree of connected data sources
- Lineage
- Parameters
Governance
- Users
- Roles
Operations
- Promote (transfer objects between environments)
- Monitor
- Schedule
- Alerts
- Dashboard (see below — distinct from Quick Access)
Pinned at the bottom
- Activity Log (visible if you have audit-viewing permission)
- Settings, which expands into its own sub-navigation: Appearance, Security (permission-gated), Authentication (permission-gated), Email (permission-gated), Compute (permission-gated), Integrations (permission-gated), Version Control (permission-gated), Agents (permission-gated)
Several of these Settings pages only appear if your role has the relevant permission — someone without user-management rights, for instance, won't see Security or Authentication at all.
7. The Other "Dashboard": Platform Overview
It's worth calling out that Dashboard in the sidebar is a separate view from Quick Access — easy to conflate since both could reasonably be called "home." Where Quick Access is about your recent activity, Dashboard is an operational overview of the platform's execution health, titled "Platform Overview" in the UI. It includes:
- A KPI row: Total Runs, Running Now, Success Rate, Failed Today, SLA Breaches, Data Volume processed, Average Duration, and Active Executions
- A scope filter (All / Global / Project) and a date-range picker (7D / 30D / MTD / YTD / custom)
- A run-status donut chart (success / running / failed / pending)
- A Live Monitor panel of currently active executions
- An Incident Log of recent failures with their error messages
- Quality & Compliance stats (SLA health, success ratio, breach count, error count)
- An Engine Throughput panel (data materialized, batch run count, average execution time, concurrency peak)
- A full recent-execution audit table, with a link through to the complete Monitor view
This view auto-refreshes every 30 seconds while it's open.
8. One More Thing: Session Behavior
Sessions don't just sit open indefinitely. DataKnits tracks idle time, and when you've been inactive for a while, a modal warns you that you'll be logged out in 30 seconds, with a "Stay logged in" button to extend the session. If you don't respond, you're signed out — and the next successful login for that same user and tenant will attempt to restore the tabs you had open, so you don't lose your place.